
Supply Chain Project using Power BI
- Scott C
- Jun 5, 2023
- 4 min read


Introduction:
In this project, I was to play the role as an applicant for Sword Consulting groups. The data is for DataCo Global which was acquired by the Sword Consulting Group. Looking into supply chain analytics can be very important because it can help a business predict future demand. They can decide what products are less profitable and what products are more in demand. The goals of the study were to answer the following questions.
Where does the company make the most money?
How can we have less late deliveries.
Overview:
On average the most money is made from the sale of computers
The United States spends the most overall money
Data:
The data was accessed from Medeley Data. The information is a dataset of supply chains related to provisioning, production, sales, and commercial distribution. The information provided involves information on delivery and shipping, types of products, city and country of customer, department, profit, etc. This analysis focused mainly on where the most profit was made and data related to lateness and shipping.
Analysis:
When it comes to business, the main goal is typically to make money. The first goal was to figure out where the money is coming from. Where should the business focus their effort on? The graph below is comparing the average benefit per order by the category name. In this case, benefit per order refers to the earning per order placed.

The graph shows that computers earns over 100 more than the second most profitable category of garden. Out of the top 10 categories, four could be further grouped into the electronics section (computers, cameras, music, consumer electronics).
In order to further look at sales, data was plotted on a map where the larger the spot, the higher the amount of earnings made in that country. In the case of this map, the United States would be the country that spends the most money.

Looking at the map, North America and multiple countries in Europe make up the bulk of the spending. Australia and Brazil would be the next two biggest spenders.
After looking at the overall spending, the focus was on how to improve on late orders. First the average days it takes to ship was compared to the scheduled amount of days for shipping. This was looked at across four types of shipping. This includes same day, first class, second class, and standard shipping.

By looking at the graph, it is clear that standard class and same day have the smallest change between the expected and real number of days of shipping. It appears that first class has the highest number of expected days followed by the scheduled while second class has the next highest.
In the following graph, there is a comparison between the average number of shipping days being compared to the risk of having a late delivery.
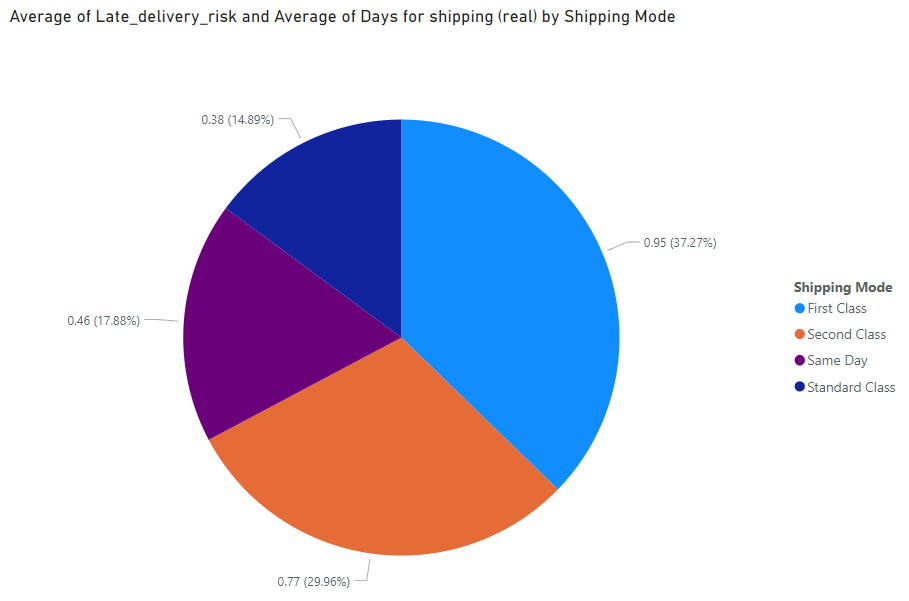
When looking at the largest slice of pie, first class shipping has around a 37% change of being late. Second class comes next with around a 30% chance of being late. Same day and standard class only make up around 18% and 15% respectfully.
Main Takeaways:
The main takeaways are that the most money comes from computers and most of the money comes from the United States. When it comes to late packages, the majority of late sales comes from first class and second class mail. The late packages makes sense because standard mail takes the longest, so there is a longer window of time for the mail to be considered "late." Since same day mail typically involves having a nearby distribution center, it is also expected that they won't tend to be late. First class mail and second class mail are likely more late because the expected window for deliveries 1-3 for first and 2-4 for second are much easier to miss due to extenuating circumstances.
What now?
The recommendations for DataCo Global would be to focus on specific items that they sell. For example, some of the lower in demand items could be considered "dead-stock" and be taking up precious inventory space. These items could be dropped and a focus more on electronics could lead to a higher benefit per order. Since the United States spends the most overall money, it could be important for the company to put further resources in seeing what items Americans by and how they can further make money in the region. It could be important to look into the highest purchased item in each country and move a focus to making those particular items more accessible based on each reason.
The second concern was to figure out how to reduce late deliveries. The biggest factor that could help reduce "late" deliveries would be to better educate the customers on what each of the different shipping methods involves. Knowing the number of days first class and second class take can help customers understand how long the packages will take. DataCo Global could adjust the days for first and second class to be later. For example, it they state it will take 2-4 days for first class, it is less likely to be considered late. Having a disclaimer that supply chain issues and weather can impact the delivery could also help the customer be better informed. The customer can also make better decisions on their end by making sure packages are correctly labeled and to focus on not making shipments on holidays.
With these suggestions, it is expected that DataCo Global can be more confident on where to focus there energy. Educating the customers and dropping less purchased products will go a long way in the overall success of the company.


Comments